Sheet 05.3 — Field note
The budget that measured itself
A trace of one request, stage by stage, is what explained a bad number. A search timeout had moved from eight seconds to fifteen on the strength of one measurement, and within ninety seconds of the deploy two searches were cancelled at fifteen point one.
- Published
- Reading time
- 10 min read
- Drawn by
- E. Knuth
The build went out at 21:05 UTC on the ninth of September. It changed one number: how long a search may run before the database cancels it, from eight seconds to fifteen. That number is the search’s time budget. At 21:06:23 a search was cancelled after 15,125 milliseconds. Fifteen seconds later another was cancelled at 15,131. The ceiling had moved and the failure had moved with it, landing 125 and 131 milliseconds past the new number.
The app behind it is a clip search over 300 public-domain films from the Prelinger collection. Every search runs one SQL function against a vector index, under a statement timeout. The vector index is the structure that finds the stored frames most like the words typed. The statement timeout is the cap Postgres puts on how long a single statement may run before it kills it. The number behind raising that cap was 8.5 seconds. That was one call to the function, measured from a script after the database had sat idle for eleven minutes. A stand-in vector of all zeros stood where a real query would go, and there was no policy filter on it. Fifteen was about double, and double read as headroom.
What a timeout reports
A timeout is an instrument, and what it reports is its own setting. Every failure in those two days that ran past a second sits exactly where the ceiling was. On the eight second build, cancellations at 8,119, 8,167, 8,171 and 8,213 milliseconds. On the fifteen second build, 15,125 and 15,131. None of those is how long a query took. Each is the timeout doing what it was told to a query that was still running.
Eleven more cancellations on the eight second build came back under a second, some in three milliseconds. That cannot be a query that ran that long. The issue that fixed them read them as a timeout inherited from an earlier caller through the connection pool, the set of database connections the app reuses between requests. Its decision note leaves the mechanism open. They are drawn in the figure anyway. Hiding a cancellation would be the same mistake in a smaller form.
The long ones are easy to read the wrong way, and I read them the wrong way first. A cancellation at 8.2 seconds looks like a measurement of an 8.2 second query. Raise the ceiling and the new number looks like new information about a slower query. It is the same query either way.
The plate at the top is every one of those spans. A span is one timed operation inside a request, with a start and an end. This one wraps the database call. The build with the fifteen second ceiling answered 208 of 210, between 21:05 and 21:22 UTC. All of it was my own scripted traffic: a post-deploy check of twenty paced requests on each of two paths, then a rerun of the retrieval eval. The two paths are uniform and guided. Uniform searches one kept frame per second of film. Guided searches only the frames kept by a policy that follows the narration. That check’s table puts guided’s median at 521 milliseconds and uniform’s at 1,307, which is where the two dense columns sit. Across all 210 the median is 1.25 seconds, the ninetieth percentile 2.2, the ninety-ninth 8.90. The slowest answered span reads 8.93. The next two marks are the cancellations at 15.1. The six seconds between hold nothing.
Read that as a plain distribution and it says the database costs up to about nine seconds and then separately costs fifteen. That invites a different kind of fix: a retry, or another move of the ceiling.
The gap is an artifact of the instrument. Those two marks record only that two queries ran at least fifteen seconds. The distribution is censored there, cut off by the same knob the last change turned. From the inside it says nothing about what they would have cost.
What was actually wrong
The hypothesis at filing time named Hyperdrive, which pools and reuses database connections in front of the app. The guess was that it was interacting with Postgres plan caching on the guided path. Guided is scene cuts plus the narrator’s pointing frames, and its filter passes about nine percent of the rows. Part held and part was about the wrong path.
The plan cache part held. Before Postgres runs a query it plans it, choosing among other things
whether to walk an index or read the whole table. Postgres 18 caches a SQL function’s plan per
backend session. A backend session is one server process, which a pooled connection keeps
talking to. From the sixth execution the planner will consider swapping the custom plan for a
generic one. The custom plan is built for the actual parameter values. The generic one ignores
them. An unknown limit pushes that generic plan off the vector index on its own. So does the
policy filter’s unknown selectivity, the share of rows it lets through. Thirteen executions on
one backend session read 48 to 55 milliseconds for the first four warm readings. The fifth warm
reading, which is the session’s sixth execution, read 41,367. The rest read 2,100 to 2,650.
Hyperdrive’s role held too. It reuses a backend session across many requests, which is what
lets a sixth execution happen. plan_cache_mode = force_custom_plan, set inside the function,
costs about six milliseconds a call and holds every execution at 47 to 53.
The guided part fell over. Guided had no plan-cache switch, because it had no good plan to
lose. It was on a sequential scan, a read of every row in the table, from its first execution,
permanently. The guess about selectivity was wrong too. The planner’s row estimate for guided
is 24,982 against an actual 24,738. The estimate is right and the price is wrong. A
vector(1152) is 4,616 bytes, too big for Postgres to keep in the main row. So every vector
lives in TOAST, the side table where oversized column values go. The frame_vectors table
proper, which Postgres calls the heap, is 20 MB. The vectors beside it are 1,322. A sequential
scan is costed on the heap. Pulling the vectors out of TOAST to compute distances is costed at
nothing. In its own cost units Postgres priced the scan at 11,174 and the index walk at 19,891,
and took the scan. The scan read 211,655 buffers, the pages it had to fetch. The index walk
reads 23,468. enable_seqscan = off scoped to the function moved guided from 497 to 874
milliseconds down to 61 to 67. Two more policies were on the same plan, so three of five calls
were scanning.
The forty second reading
The measurement table in the timeout issue carries a row I could not drop: 40 seconds on the
first transition, the first time a session’s plan switched. It is the plan-cache switch on a
compute with nothing in memory. A compute is the server the hosted database runs on. The
generic plan on the uniform path reads 173,340 blocks off disk, about 1.35 GB. The compute
reports 294,408 kB of shared buffers, Postgres’s own cache of table pages, at its 0.25 CU
floor, the smallest compute it is set to run at. So the scan never fits Postgres’s own pool.
The cache above it is a page cache that a resume empties. The host suspends the compute after
five idle minutes and resumes it at the next query, so a resume is routine. The three readings
above 30 seconds the timeout issue found all happened within about a minute of a restart of the
Postgres server process. The 41,367 reading came later, on a session whose compute state went
unrecorded. It belongs beside that set rather than in it. With force_custom_plan in place
that execution reads 48 milliseconds.
One piece stays open. Whether the same transition on a long-warm cache would also miss fifteen seconds was never measured. The closest reading on file is 3,023 milliseconds, from a plan inspection rather than a fresh transition.
What settled it
A trace of one request, stage by stage, and it existed by an afternoon. The figure below is a
frames search on the live site the following midnight, drawn as a waterfall. The whole
request is the top bar. Each stage inside it is a bar below, on the same time scale. The
request took 10,227 milliseconds and returned HTTP 200. Of that, 7,983 was inside
frame_search, the SQL function, and 1,051 in the embed, the step that turns the words into a
vector. The stages add up to 9,949 of the request’s 10,227. The gaps are 120 milliseconds
before the first stage and 91 and 71 either side of the database span, which comes to 282. The
health probe overlaps the embed by 4, which leaves 278.
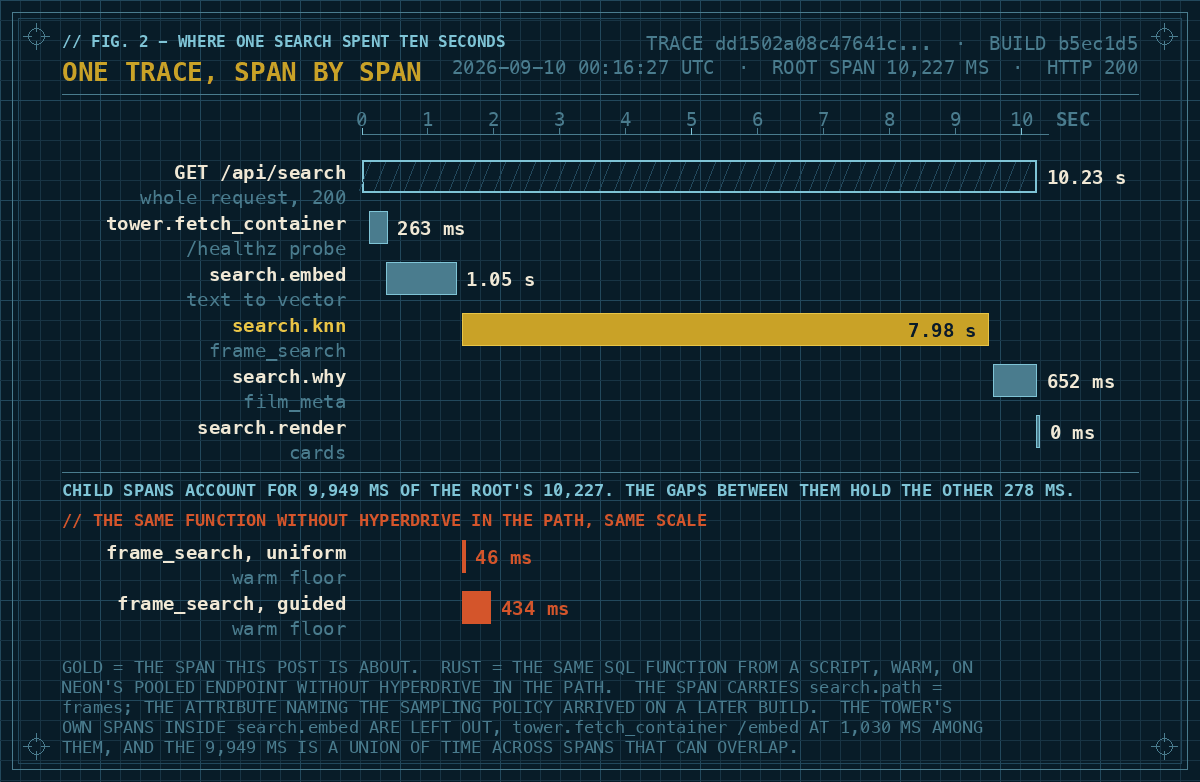
So the 162 milliseconds either side of the database span is all the room there is for the pooler and the connection setup. The time is inside query execution. The rust bars are what the same function costs from a script on Neon’s pooled endpoint, without Hyperdrive in the path. The pooled endpoint is the hosted database’s own connection pooler.
Two frames searches on the same build ran 8,656 and 8,062 milliseconds four and a half
minutes earlier. That is inside the five minute autosuspend window, the idle time the host
allows before it switches the compute off. Nothing recorded whether the cache was warm. So that
trace stays unclassified rather than called cold.
The span does not name the sampling policy, because the attribute that names it was added after this build. Seven requests on the same build in the seventy seconds after it read 407 to 542 milliseconds in the same span. Every uniform reading on file sits elsewhere: 46 milliseconds direct, 759 and 774 live and unexplained, a 1,307 millisecond live median on the post-deploy check, a 2 to 3 second plateau after the plan switch. Guided’s median on that check is 521. So it was guided, by inference from timing, and I am marking it as one.
The tracing had landed the day before: three runtimes reporting into one trace, one clock across all three. Its review caught stage spans that were opened before the slow call and closed after it, with nothing to catch the call throwing. A query that hit its timeout threw past the close and lost the span that named the failure. The two cases the work existed to explain were the two it would have stayed silent about.
Where the ceiling is now
Still fifteen seconds. Both fixes landed. A later issue gave the guided path an index the size of its own answer: 98 milliseconds at the median through the live route, 194 at the ninety-fifth percentile. The uniform path still walks the whole index, at 935 and 1,687.
The ceiling was never sized from those numbers. It bounds one statement, and what it has to clear is the worst that statement does: a query new to a compute that has just resumed from its five minute autosuspend. Six of those in a row measured 4 to 6 seconds each with no decay, on the build before the per-policy index. Nothing since has measured that case again. The ordinary cost is the wrong input for the decision. So was the 8.5 second reading, a stand-in vector on a path that was never the slow one.
The fix I would want is smaller than any of those. A request that fails at exactly the ceiling carries one bit of information: the query ran at least that long. Treating it as a duration is what sent the budget to fifteen. The plate above should have been drawn on the first day, with cancelled spans marked as cancelled. Drawn that way, the censoring is the first thing you see.
The app is live at clip-portal.eknuth.dev. The build log, one entry per landed issue, is at clip-portal.eknuth.dev/log. The repository opens when the piece ships.